If your BRF rule doesn’t work as expected you might need to debug it. BRF+ generates an ABAP class for each BRF function.
To debug it, you need to find out the generated class name first.
There are 2 ways to do it:
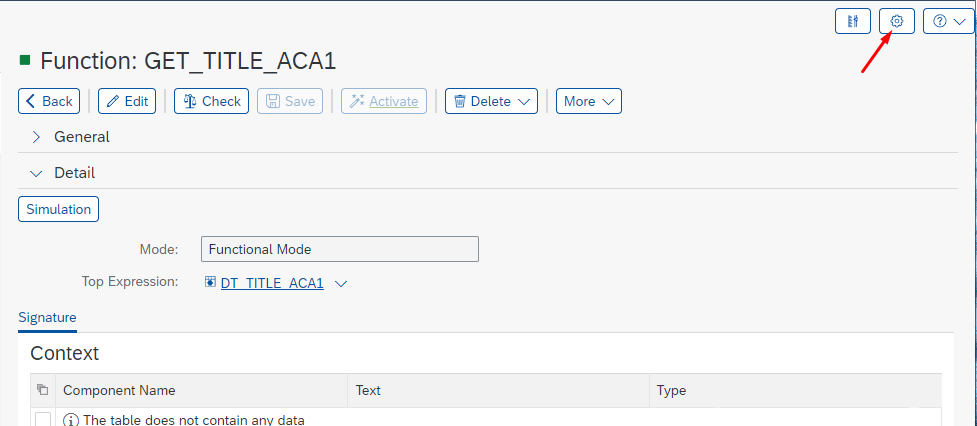
- Change User Mode to Expert
- Click on Personalize:
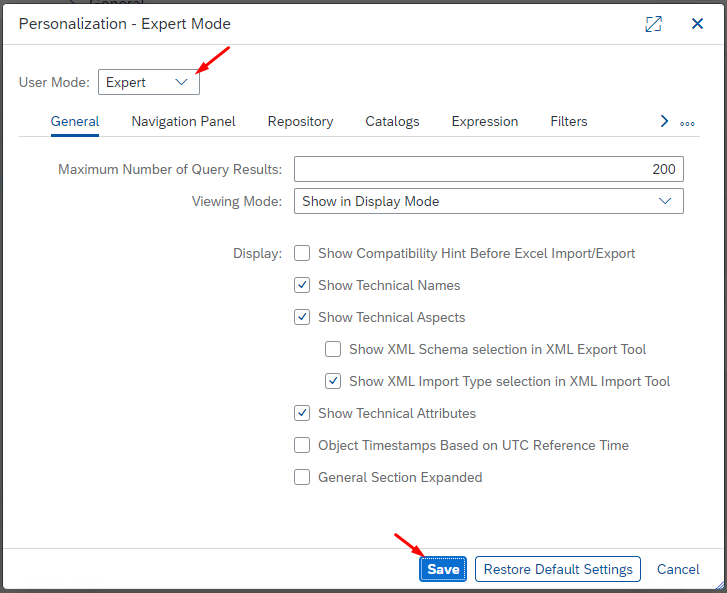
- Select User Mode – Expert and click Save:
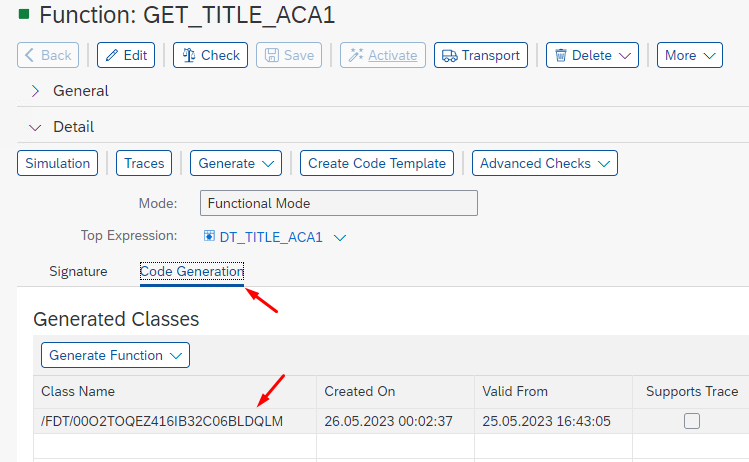
- Go to Code Generation tab to find the class name:
- Click on Personalize:
- Alternatively, run report FDT_GENERATION_TOOL (SE38)
- Provide Function ID and Execute (F8):
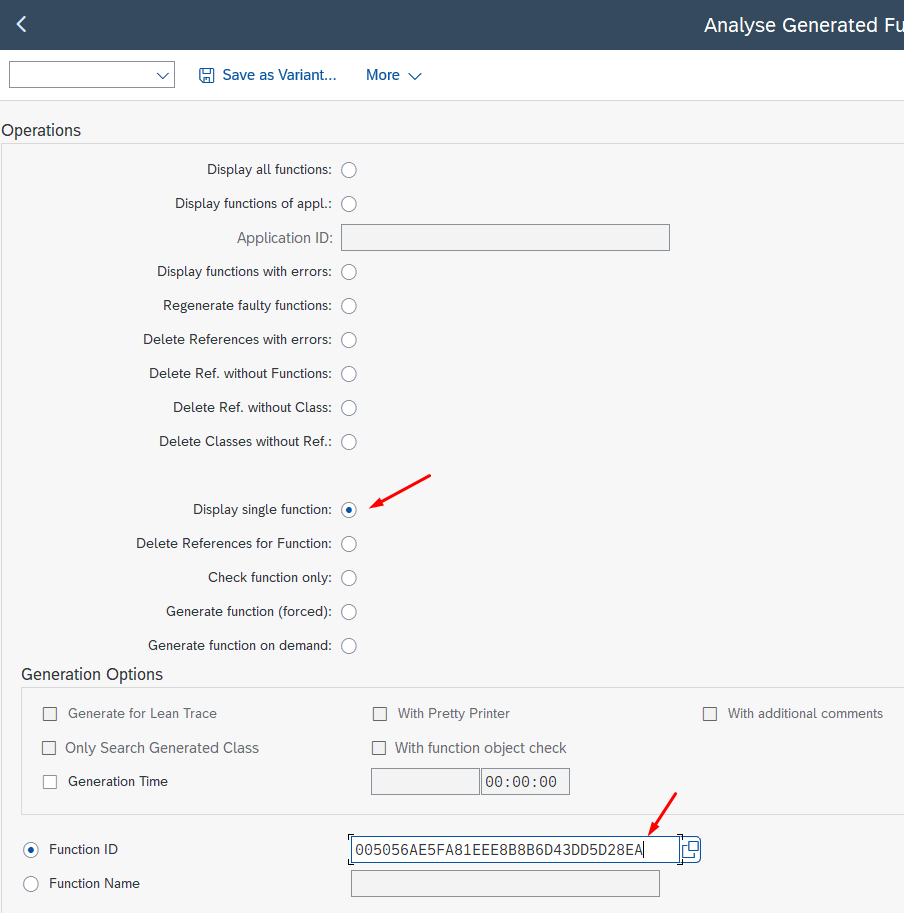
- Class name is provided in the output table in column Object Name:

- Provide Function ID and Execute (F8):
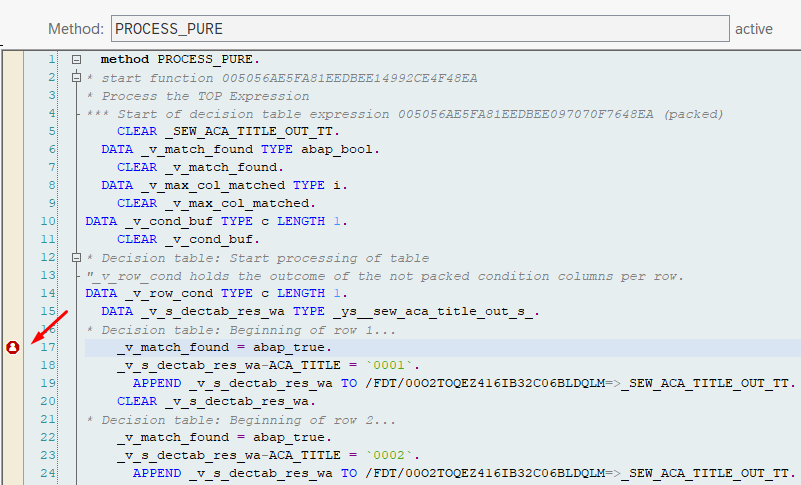
Open the class in SE24 / ADT and put an External Breakpoint (for your user) in method PROCESS_PURE
Execute your code calling the BRF Function.
That’s it!
You can now start debugging your BRF+ Function.
Still cannot solve your issue?
Our experts are always ready to help.
Get in touch and ask for a consulting offer.